Are Your Energy Savings Real? How Independent Validation Exposes False Savings Claims
Too often, cost savings reports say whatever the consultant wants. The savings may be fake, but the costs are real.

Energy performance contractors make big promises, and their reports tend to show results in line with those promises. But how real are those results? How do you know they’re delivering on those promises if nobody else is checking?
Too many facilities we know are getting doctored cost-savings reports that make the contractor look like a genius, when the “results” they’re crowing about are far less than promised (or don’t really exist at all). Someone you’re paying shouldn’t misrepresent your results (aka lie to you).
It’s weird that they’re lying, too, because it’s useful to know when something doesn’t work. That’s one more piece of the puzzle, which gets you closer to finding out what does work for your facility.
So why make up results? Our best guess is that they don’t have any other tools in their toolbox. Their operational understanding is low, so they figure out a way to show the results they’ve led you to expect. Most facilities don’t have the time to go over the savings reports in detail, so clients remain in the dark about what their true utility costs are and how to actually get those costs down.
A Recent, Real-Life Example
We’re working with a world-class healthcare campus. This institution spends about $3M on electricity in a given year, plus vast amounts on other utilities. To help them minimize their costs, the client hired an energy performance contractor (let’s call them “EPC”). And then they hired us to validate the contractor’s work. So our role in this job is M&V (although we sometimes make an energy recommendation when we see a good savings opportunity).
Every month we go through EPC’s cost report detailing what changes they recommended and how those changes impacted the client’s utility consumption and costs. We constantly find mistakes in those reports – big mistakes – that imply that EPC’s reported savings are far less than they claim. In other words, they claim big money, but the data doesn’t bear it out.
What kind of discrepancies are we talking about? Here are two that really stand out.
Claim: $171K+ in natural gas savings due to cogeneration
But cogen was off during the period in question. So what is this number? How did they even arrive at this amount?
Claim: Demand response savings of $378K annually
Maybe EPC was looking at savings for one part of the systems loop and extrapolated the savings out. They definitely didn’t look downstream of the change. We did. The DR savings were actually $202K. So there were savings, but not as much as indicated. Our point: This isn’t high school, and clients shouldn’t be expected to give contractors partial credit.
Where the Big Errors Came From
1. Frankly atrocious facility “baseline”
EPC was using 24 (!) points to create a “baseline” for this extremely complex facility. utiliVisor is using 8500+ points to create the baseline we use to evaluate their savings estimates. It’s basic statistics: A baseline made of a small number of points is almost the same as guessing. More points and more historical data = closer modeling of reality and therefore more reliable savings predictions. Doesn't $3 million in annual electricity costs deserve more than 24 points?
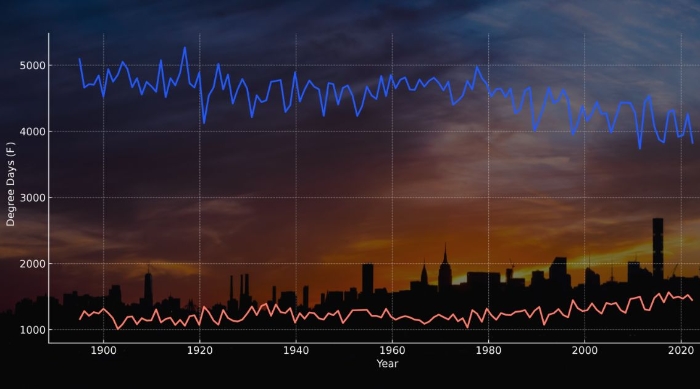
2. Improper normalization for weather (OAT & OAWBT)
You might be astonished at how many supposed “experts” don’t know how to normalize for weather conditions with a high degree of accuracy.
(Read more about weather normalization in our article on Degree Days.)
3. Taking credit for recommendations we made
The cheek! Claiming credit for someone else’s work tells you a lot about EPC. They thought no one would notice that 45 (!) of the recommendations that resulted in real savings came from our engineers, not EPC.
4. No month-over-month or year-over-year comparisons before extrapolating to long-term savings
Conditions don’t stay the same over time. It’s great if something worked well this month. That doesn’t mean you can rely on it to achieve the same result every month for the next 30 years.
Ways That Savings Get Overblown
We believe lessons learned should be lessons shared. Here’s a list of the types of mistakes we’ve found in EPC’s cost reports over the last two years:
- Claims of credit for savings achieved by someone else
- Claims of savings actually due to lower use (e.g., fewer patients, fewer scans, etc.)
- Poor weather normalization
- Wrong data for the period (it’s amazing how often this happens)
- Poor baseline (too few data points to make accurate estimates)
- Not actually having baseline data and just assuming what the savings “would be”
- Listing partial savings (looking only at savings from changes to Equipment A, without taking into account the impact “downstream” on Equipment B through Z)
- Getting the basics wrong: incorrect rates, charges, and fees
These kinds of gamed reports get our dander up not only because you as their client are being sold a false bill of results, but also because it wastes your limited resources (time, money, and literal and personal energy) on fake solutions. Imagine believing for 26 years that you knew the best ways to control your utility consumption, only to find out all those reports were meaningless.
You Might Like
About utiliVisor
Your tenant submetering and energy plant optimization services are an essential part of your operation. You deserve personalized energy insights from a team that knows buildings from the inside out, applies IoT technology and is energized by providing you with accurate data and energy optimization insights. When you need experience, expertise, and service, you need utiliVisor on your side, delivering consistent energy and cost-saving strategies to you. What more can our 45+ years of experience and historical data do for you? Call utiliVisor at 212-260-4800 or visit utilivisor.com