What's Wrong With Using Degree Days to Estimate Savings
Degree days are handy in a pinch. They also dramatically exaggerate savings estimates.

What Are Degree Days?
Degree days are a method of normalizing the impact of weather on energy consumption using outside air temps as a proxy for weather in general. The goal is to subtract the effect of weather over time so you can compare building or equipment efficiency over time without having to take into consideration weather fluctuation. Using degree days is a popular approach to building an apples-to-apples comparison because temperature data is relatively easy to find and easy to apply.
(For those new to the term, “degree day” can be confusing. A more appropriate term would be "degrees in a day, but somehow that hasn’t caught on.)
To start, “degree days” come in two main flavors: heating degree days (HDD) and cooling degree days (CDD). An HDD is an estimate of energy requirements to warm a space that has central heating above a given temp, and a CDD is an estimate of energy requirements for air conditioning or refrigeration of a space below a given temp. The traditional "base" value for these comparisons is 65 degrees F (though ConEd has recently switched to 57.5 degrees F). The higher the degree days value, the more extreme the temperatures were on that day and therefore the harder the operations systems likely had to work to keep the building comfortable.
If that explanation doesn't quite make sense, try this example about degree days from the National Weather Service:
“Typically, cooling degree days are calculated as how much warmer the mean temperature at a location is than 65°F on a given day. For example, if a location experiences a mean temperature of 75°F on a certain day, there were 10 CDD that day because 75 - 65 = 10.”
How Degree Days Are Used in Operations
When it comes to building efficiency, degree days are often used to model the relationship between weather and energy consumption of energy, sometimes called weather normalization or weather correction. The aim is to create an apples-to-apples comparison of system performance over time or in different regions by simplifying and hopefully removing the weather factor. The calculations to do this sort of comparison vary from simple ratio normalization to regression analysis to removing the baseload (non-weather-dependent) energy consumption. Say, for example, that you wanted to compare energy consumption this August with last August to see if ECMs were having their expected effects.

The raw values in the table above indicate that the building used less energy this year than last year. However, perhaps you know that in your area, this August was cooler than last year’s, so you’d expect less energy to be used. But you don’t know, then, if the decrease in kWh occurred because of your ECMs *rocked* or because the weather was just cooler so you didn’t operate your chillers as often or as hard.
This is where weather correction techniques come in. If you can factor out weather impact, you have a much better understanding of how well your systems are actually operating and what changes are actually helping.
The Problems With Degree Days
1. It's not (just) the heat...
Observant readers will already have spotted the major flaw in degree day estimates – that degree days are often calculated using dry bulb temps (but see the note below), meaning that humidity isn't taken into account. We all know that humidity is a major factor in thermal comfort. Calculations that don’t factor in humidity (or wind or solar gain, where those are important) will be inaccurate.
(Note: Some places that provide or use degree data info are starting to include dew points or wet bulb temps to account for humidity in their degree day assessments, making those cooling degree day assessments more relevant. Your mileage may vary.)
2. Billing periods don't match calendar months.
Another common way that degree days mess with efficiency analysis is an oldie but always a goodie: calendar vs billing period. Your billing period rarely corresponds to the calendar month, which can lead to some significant inaccuracies. This problem may balance out by comparing longer periods, but it’s important to be aware – as always – of this issue when evaluating over smaller time increments.
3. Weather data isn't standardized.
Like anything else, weather data varies from source to source, and how degree days are calculated also varies. As we said, the threshold temperature value for degree days is usually 65°F, but ConEd, for one, is now using 57.5°F, which would cause a dramatic shift in your analyses if you were unaware of this change. ConEd is also averaging dry bulb and wet bulb temps in its degree day formulations these days (a good change, but still a change). Another issue is choosing weather station data favorable to your goals, rather than the weather your location really saw. Be sure that you know where your degree day info is coming from and how it's calculated, so you have the most accurate comparisons possible.
Are Degree Days Good for Anything Then?
Degree days are a quick and easy way to build a baseline to help compare efficiency over time. But what you gain in ease you lose in accuracy.
Here's an exaggerated example of the issue: if you raise a set point on the chiller and then compare total building BTU this year vs. last year, you could say that any savings is due to that higher set point. But it could also be due to decreased tenant load or a hundred other factors you’re not taking into account.
And if you use dry bulb temps for your predictions, your estimates are likely to be off. Like wayyyy off.
That said, if no other data is available, will we use degree days? Sure, in a pinch and with a grain of salt.
Will we recommend major decisions off degree day analysis? Definitely not. In our experience, degree days tend to inflate savings, giving a false sense of accomplishment that will be painful when reality hits.
How painful can it be? Here's a story about how using degree days overinflated one property's ECM savings by more than $100,000.

Duped by Degree Days
A hospital client wanted to find the most efficient way to meet cooling requirements.
They had been running water through an offline chiller to increase flow when colder water wasn’t needed but the facility wasn’t meeting its hydraulic requirements. The problem was that running water through the offline chiller added additional tonnage to the plant (with no benefit).
We recommended they stop running water through the offline chiller and instead slightly "overpump" the online chiller to increase the flow and deal with the accumulated heat. (The tonnage was still below the machine’s max. This strategy isn't right for everyone: it depends on the size of your chillers.)
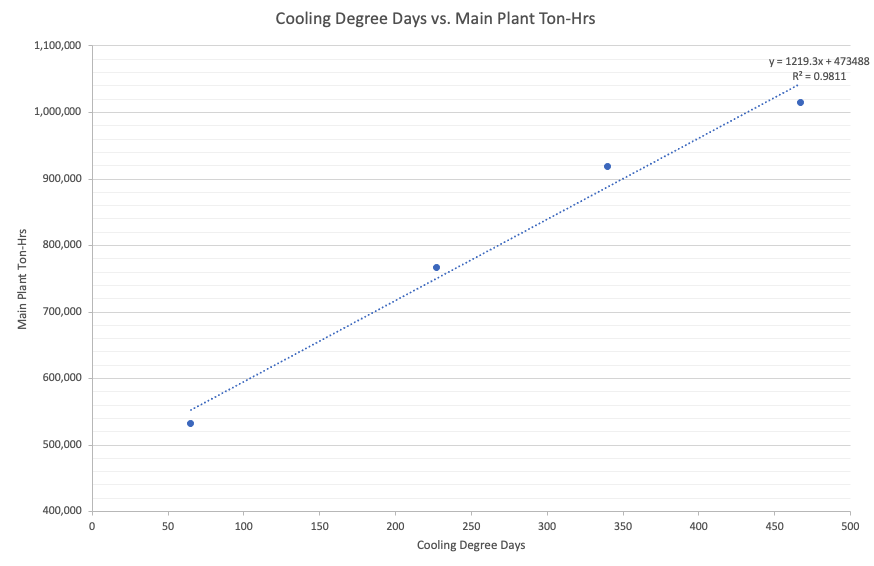
To measure the benefit of this recommendation, you could use degree days. The basic method is to regress the ton-hrs from the previous years to get a line of best fit with regard to degree days. You then use that line to calculate what the ton-hours would have been without the ECM and compare those estimates against this year’s actuals, hoping that the degree-days fit accounts for variations in weather between the two years.
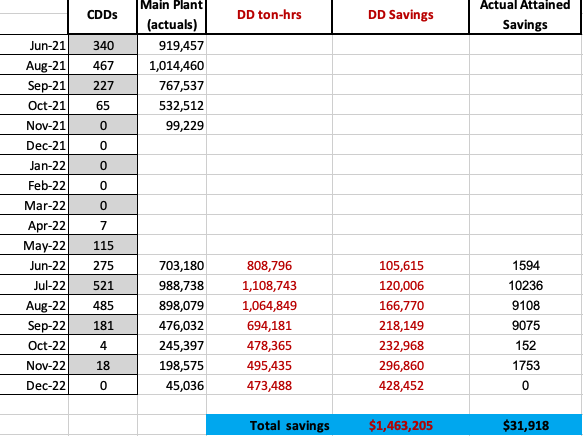
The chart below shows a weather normalization calculated using degree days. The table shows the data used for the regression (from Jul '21 to Oct '21). It also compares this year’s recorded ton-hrs with the model’s estimated values, using each month's total degree days to determine the estimated ton-hr values. The rightmost columns show the comparison of savings between a degree day calculation and a more surgical calculation based on remote meter data.
Why Degree Days = False Promises
As shown in the table, controlling for weather impacts using degree days results in a tasty $140K from June through November. This is fantastic. And it’s fake.
This is our main beef with using degree days. They sound like a nice, straightforward approach to normalizing for the impact of the weather. Unfortunately, it doesn’t give you insight into the problem you’re actually trying to understand. Why not? Because it isn't detailed enough to give a precise answer. It’s a very broad brush with which to try to show sharp details. Just because the month of September happened to have 181 cooling degree days in it does not tell you how hard the cooling equipment had to work to reach thermal comfort this September compared to a previous September.
Degree days also contribute to double dipping on your savings. Because you’re looking from such a distant viewpoint, you can’t say for sure what caused any change in consumption. Instead, degree days tend to attribute savings to a single cause that actually result from multiple causes.
Interval Meter Data for the Win
Instead of using these bulk numbers, you can get a lot closer to true attained savings for each ECM by using the remote meter data.
Here’s how we dialed in on actual savings: We started by narrowing the data set to the specific chiller sequence impacted by this ECM and only above 60 degrees dry bulb (because we know that when the outside air temp is less than 60 degrees, the site isn’t pumping water through the chillers anyway, so exclude that data). We then determined the before and after values for that specific condition. Using the remote meter data under that specific temperature constraint, we determined the exact savings of this ECM to be 286 ton-hrs, or a total of $31,918 over the same 6-month period. It’s not as dramatic, but it is real. You won’t have to take it back later.
The degree days estimate is easier to explain and easier to do. It doesn't involve hundreds of data points and spreadsheet wizardry to produce. But that's exactly what's wrong with it. It's basic. Reality, on the other hand, is complex.
Again, does this mean we recommend against using degree days entirely? No. Sometimes you're only looking for this sort of back-of-the-napkin estimate. Sometimes you don’t have the data you need to be more precise. In those cases, degree days at least give you SOMETHING. All we’re saying is that degree days are more of a cleaver than a scalpel.
A Recommendation
Weather's effect on operational costs varies. Some properties, like healthcare and research facilities, are more sensitive due to their need for high air exchange rates. Standard commercial buildings aren’t typically impacted by the weather as much, and their chiller plant represents a small percentage of their overall energy consumption. If your supply fans consume as much power as your chiller plant, humidity is less important to you than a hospital with 100% air exchange.
But even if your facility costs don't correlate with the weather, we recommend this one practice for all: have a secondary source for weather data in addition to your BMS (we use WeatherKit), just to be sure any weather-sensitive data will be useful to you if and when you want to use it.
In our 40+ years, we’ve dealt with our fair share of flawed weather data, from equipment failure to a humidity sensor being full of rainwater to one that was located right next to the kitchen exhaust. Accurate data is the backbone of efficiency. A little extra time and money spent confirming your conditions will not only help you identify system problems, they will also make sure bad data never rains on your analytical parade.
You Might Like


About utiliVisor
Your tenant submetering and energy plant optimization services are an essential part of your operation. You deserve personalized energy insights from a team that knows buildings from the inside out, applies IoT technology and is energized by providing you with accurate data and energy optimization insights. When you need experience, expertise, and service, you need utiliVisor on your side, delivering consistent energy and cost-saving strategies to you. What more can our 45+ years of experience and historical data do for you? Call utiliVisor at 212-260-4800 or visit utilivisor.com